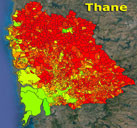

Tehsilwise Prosperity Index

Provides pan-India variation in affluence at tehsil level
This is Strategist product for marketing at the Tehsil level.
Which are the rich or wealthy areas of the country? How fast they are growing? Who are the prospective customers? These are the basic questions every marketer wants to answer. Until now, most of the analyses used to be limited to state, district or town levels. Strategist is now providing a platform to answer these questions at the next level of granularity i.e. tehsil and village. Tehsil maps with attributes as listed below are available in most of the industry standard formats.
Strategist has created a Prosperity Index for each geography upto tehsil level. For the first time one can see the pan-India variation in prosperity. Strategist’s Prosperity Index is derived from household ownership of assets and average penetration level of these assets.
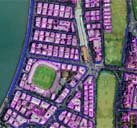
The tehsil Maps are geo-referenced using high resolution satellite imagery. Every attempt is made for high positional accuracy of map.
India missed its regular census in 2021, making the latest available census data more than a decade old (from 2011). Even the standard ten-year gap between censuses is too long given how rapidly the country is changing. To bridge this gap, we have developed predictive models using historical census data, yearly built-up area trends since 1991, and school enrollment figures from 2012 onward. This allows us to accurately estimate annual populations for tehsil.
We have also created a model to predict per capita income by using district-level GDP data from 2012 onward, local bank credit growth trends since 2005, and monthly nightlight indices since 2012 derived from VIIRS nightlight imagery. These advanced models enable precise annual estimates of GDP and per capita income at tehsil level.
Our models provide detailed annual estimates of population and per capita income from 2012 onward. Estimates for 2021 are now ready, with updates provided each year. Subscribe today for continuous access to the latest insights.
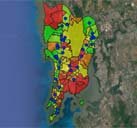
Strategist’s Prosperity Index is derived from household ownership of assets and average penetration level of these assets. Using household asset penetration numbers at city, village and ward-level provided by census bureau and coupling them with landuse maps and Tehsil / village/boundaries these asset ownership numbers are correlated to tehsil.
Our models generate annual population and per capita income estimates starting from 2012. The population model incorporates census data, built-up area trends since 1991, and recent school enrollment data. The GDP model combines district GDP data, local bank credit growth, and nightlight indices from satellite imagery to deliver accurate and timely insights.
Prosperity Index uses penetration of following assets in households:
Weightage for each asset is (100/national level household penetration of of asset) i.e. if asset penetration is 20% then weightage for it is 5 while if asset penetration is 100% then weightage for it is 1.
Prosperity_index is the sum of all above 10 assets multiplied by their weightage factor.
Tehsils have been segregated into ten classes using a clustering algorithm. Table below shows asset penetration rates increasing consistently as prosperity increases. This can be used for Pareto 80-20 marketing i.e. target 80% market by only covering 20% areas. One can also decide market segments for effective targeting e.g. microfinance ideal target is people just above sustenance but not effectively covered by banking.
| Prosperity Class | No of Tehsils | % Households | Prosperity Range | % Car Ownership | % Car Market | % Bike Ownership | % Bike Market | % TV Ownership | % TV Market | % Comp. Ownership | % Comp. Market |
|---|---|---|---|---|---|---|---|---|---|---|---|
| 1 | 715 | 6.90 | 0 - 302 | 0.79 | 1.20 | 4.73 | 1.56 | 8.12 | 1.20 | 4.08 | 3.06 |
| 2 | 1004 | 13.10 | 303 - 435 | 1.20 | 3.45 | 7.51 | 4.69 | 15.48 | 4.35 | 4.83 | 6.88 |
| 3 | 939 | 11.80 | 436 - 554 | 1.62 | 4.18 | 10.88 | 6.12 | 24.18 | 6.12 | 4.96 | 6.36 |
| 4 | 937 | 12.07 | 555 - 665 | 2.05 | 5.40 | 14.01 | 8.07 | 33.59 | 8.69 | 5.45 | 7.15 |
| 5 | 761 | 11.04 | 666 - 790 | 2.43 | 5.86 | 17.97 | 9.46 | 43.75 | 10.35 | 5.72 | 6.87 |
| 6 | 578 | 9.42 | 791 - 964 | 2.97 | 6.11 | 22.20 | 9.97 | 57.75 | 11.66 | 6.17 | 6.32 |
| 7 | 462 | 9.91 | 965 - 1227 | 4.67 | 10.13 | 26.57 | 12.56 | 64.66 | 13.74 | 8.48 | 9.14 |
| 8 | 287 | 9.63 | 1228 - 1655 | 6.96 | 14.65 | 34.51 | 15.85 | 73.97 | 15.27 | 11.75 | 12.30 |
| 9 | 178 | 10.43 | 1657 - 2514 | 11.36 | 25.92 | 42.21 | 21.00 | 80.65 | 18.03 | 19.18 | 21.75 |
| 10 | 68 | 5.71 | 2532 - 4302 | 18.50 | 23.12 | 39.38 | 10.73 | 86.59 | 10.61 | 32.48 | 20.17 |
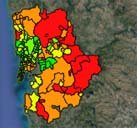
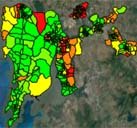
Based on the above methodology we have calculated prosperity index for tehsils of entire India. Chart below shows tehsilwise intra-state prosperity variation for top ten states.
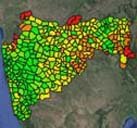
Based on the above methodology we have calculated per capita income for tehsils of entire India. Chart below shows tehsilwise intra-state per capita income variation for top ten cities.